KS2 Results
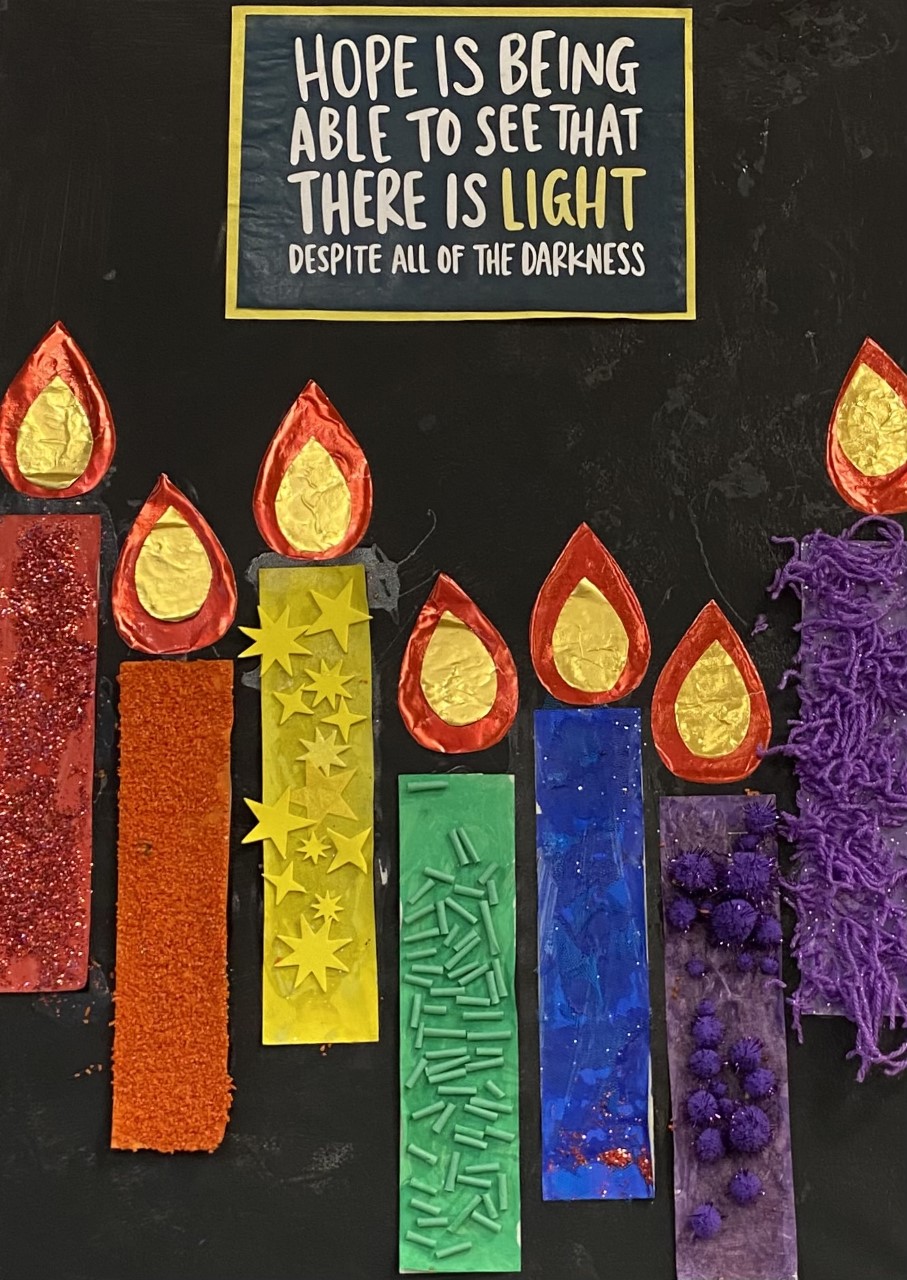
Our vision for everyone in our school community is Flourishing Together to Serve. We aim to ensure that every child achieves their potential across the whole curriculum so that they are well-prepared for the next phase in their education and for future life, with the skills, knowledge and dispositions that they will need to enable them to serve as active citizens in God’s diverse, modern world.
We are proud of our children's consistently high standards of progress and attainment. Please see the tables below for our KS2 attainment and progress data.
Reading | ||||
|
| Actual Results | ||
|
| 2023 | 2024 | 2025 |
% Expected standard+ | Moseley CE Primary Results | 81% | 87% | 87% |
Moseley CE Primary Progress | / | / | ||
National Average | 73% |
| ||
% Higher standard | Moseley CE Primary Results | 56% | 40% | 63% |
Moseley CE Primary Progress | / | / | ||
National Average | 28% |
| ||
Scaled Score | Moseley CE Primary Results | 110 | 108 | 110 |
Moseley CE Primary Progress |
|
| ||
National Average | 105 |
| ||
Writing | ||||
|
| Actual Results | ||
|
| 2023 | 2024 | 2025 |
% Expected standard+ | Moseley CE Primary Results | 69% | 83% | |
Moseley CE Primary Progress | / | / | ||
National Average | 71% |
| ||
% Higher standard | Moseley CE Primary Results | 13% | 20% | |
Moseley CE Primary Progress | / | / | ||
National Average | 14% |
| ||
Scaled Score | Moseley CE Primary Results | 100 |
| |
Moseley CE Primary Progress | -2.7 |
| ||
National Average |
|
| ||
Mathematics | ||||
|
| Actual Results | ||
|
| 2023 | 2024 | 2025 |
% Expected standard+ | Moseley CE Primary Results | 88% | 83% | 90% |
Moseley CE Primary Progress | / | / | ||
National Average | 83% |
| ||
% Higher standard | Moseley CE Primary Results | 47% | 33% | 43% |
Moseley CE Primary Progress | / | / | ||
National Average | 23% |
| ||
Scaled Score | Moseley CE Primary Results | 108 | 106 | 109 |
Moseley CE Primary Progress |
|
| ||
National Average | 104 |
| ||
Combined (Reading, Writing, Maths) | ||||
|
| 2022 | 2023 | 2024 |
|---|---|---|---|---|
% Expected standard+ (Re, Wr, Ma) | Moseley CE Primary Results | 56% | 63% |
|
National Average | 59% | 59% |
| |
% Higher standard (Re, Wr, Ma) | Moseley CE Primary Results | 13% |
|
|
National Average | 7% | 8% |
| |
Average Scaled Score (Re, Ma) | Moseley CE Primary Results | 105 |
|
|
National Average | 104 |
|
| |
Grammar, Punctuation and Spelling
| ||||
|
| 2023 | 2024 | 2025 |
|---|---|---|---|---|
% Expected standard+ | Moseley CE Primary Results | 84% | 87% | 83% |
Moseley CE Primary Progress | / |
| ||
National Average | 72% |
| ||
% Higher standard | Moseley CE Primary Results | 53% | 30% | 53% |
Moseley CE Primary Progress | / |
| ||
National Average |
|
| ||
Average Scaled Score | Moseley CE Primary Results | 108 | 109 | 109 |
Moseley CE Primary Progress |
|
| ||
National Average | 105 |
| ||